
Photo by tian kuan on Unsplash
I want to start going into more details of the categories of data use cases that I introduced in my last post. When you think of each use case, it’s easy to focus on a fairly narrow piece of it – typically the most interesting parts. But within each use case there are a number of different types of activities that can be thought of as stages in a formal or informal workflow, many of which require different sets of tools. Most of these stages appear in slightly different forms in more than one use case. By being more deliberate about considering these different stages, you can be more confident that your data platform will cover all your bases. In this post, I will discuss the different stages for each use case, and the types of tools that they typically require.
I’ll start by giving a high-level description of the different stages, independent of the use case. Then I’ll go into more detail about what each stage looks like in each of the four categories of use cases I identified last time.
Stages
We will consider five stages that each apply to one or more of the use case categories. Note that these are for the use case itself. The overall data lifecycle is a larger process that I’m planning to write more about later, in a post on data governance.
Here they are in roughly the order that they typically occur:
Collect – This stage involves getting the data from internal or external sources into a system where it can be accessed. Internal sources include operational systems, instruments and other monitoring systems. External sources could include public data repositories, data streams, web scrapers, etc.
Curate – This stage involves creating and/or organizing metadata and annotations, as well as measuring data quality and potentially cleaning up data quality issues. Some parts of this stage, particularly annotating datasets, may happen before or during the Collect stage. But based on the nature of the type of activities we’ll treat Curate as a single stage, separate from Collect.
Transform – This stage involves getting the data into a form where it’s ready for use. This may include feature definition, aggregation and generally making the data easier to query later. There isn’t always a clear distinction between data transformation and cleaning, but overall they’re different enough to be treated as separate stages.
Model – This stage involves performing analysis on the transformed data, from basic statistics to training a statistical or machine learning model. These activities will often be exploratory, but can include automated steps such as retraining an existing model on updated data. The results may feed back into the work that’s done in the Curate and Transform stages, but the analysis at this stage is primarily targeted at an external user.
Serve – This stage is where the results of the analysis from the Model stage make it to the end user. Depending on the use case, this could be via a server, such as an API or a dashboard, or it could be simply sharing a report or slide deck. Some types of serving, such as dashboards, allow a limited amount of exploratory analysis so we again have some ambiguity between stages, but there’s enough of a difference to treat Serve as a separate stage from Model.
If you’ve worked on or are working on a data project, you can probably start to map different aspects of that project to these stages. And hopefully breaking it down like this will help you identify what kinds of tools you’ll want to have available for different types of projects.
In the rest of this piece, I’ll go through what these stages look like in each of the use case categories and what kinds of data tools are commonly used. These are summarized following Figure, which may be enough for you to fill in the details yourself. But for a longer explanation of each of the boxes, read on below:
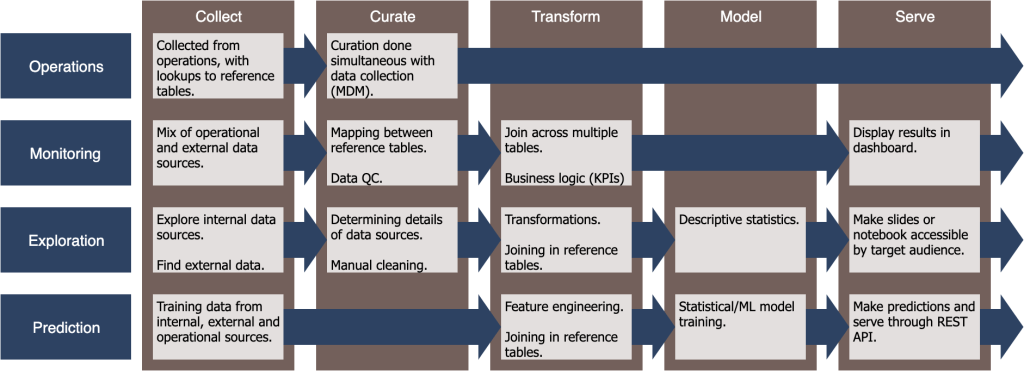
Operations
The Operations use case covers most processes that address individual data entries, often as a side effect of some other process. Since the Transform, Model and Serve stages all deal with bulk data, only the remaining two stages – Collect and Curate – apply to this use case.
Collect: Data collection is the central goal of this stage, as users document the work that they’ve done, and other related information. This is typically done through software that is purpose-built for that specific type of work: inventory systems, project/task management software, CRMs for sales, EHRs for hospitals. etc. These different pieces of software then need to be connected/integrated into a larger platform both to sync related data between them and to collect the data in a form that the other use cases can access. However, there are starting to be more generic data collection tools such as Airtable that can cover many of these use cases in a single system.
Curate: Because data collection is the only use case where ground truth is available, it’s the ideal place to enforce data quality. Curation can be done manually by having an explicit review step in standard operating procedures, but there are also more automated ways. For example, you can run processes that check all new entries for consistency and common errors, and alert the user as soon as issues are found. You can also sync reference tables across the different systems to ensure that there aren’t conflicts later. This is sometimes called Master Data Management (MDM).
Monitoring
The Monitoring use case involves applying a pre-defined analysis to ongoing snapshots of data.
Collect: In this use case, data collection is a matter of gathering snapshots of datasets that either come from Operations use cases, or that have been collected and possibly processed/transformed in some other way. The key complexity here is that this must be done consistently and repeatably, which is particularly difficult for external sources in which you can’t control the reliability. So any automated approach must either be fault tolerant or must have built-in tools for manual intervention.
Curate: Again, the primary complexity in this stage comes from consistency and fault tolerance. Before the data can be processed and transformed, the pipeline should check for common data quality issues, and for statistical drift compared to earlier snapshots. This is particularly important for external datasets where you can’t control any preprocessing or transformations that happen before you get the data. If a data provider decides to change these, your downstream statistics may end up being meaningless.
Transform: If the Collect and Curate steps are reliable, then consistency shouldn’t be an issue for this and later stages. Instead, the complexity for the Transform stage comes from business logic such as Key Performance Indicators (KPIs) and the fact that it often involves data spread across multiple data sources with different conventions. There are a number of frameworks for defining this business logic, from graphical UIs like Tableau to query languages like SQL, and even procedural frameworks like Spark. These frameworks often include the basic statistics you need for this use case, so we’ll include that in the Transform stage rather than a separate Model stage.
Serve: The results from the Transform stage are typically served via a dashboard. The user in this stage is typically different from the person who defined the business logic for the Transform stage. Most of the graphical UI frameworks for defining transformations will have a built-in system for making dashboards available to these users. For the code-based options, you’ll often need a separate framework for serving dashboards.
Exploration
The Exploration use case involves one-off, custom analysis that often ends with a slide deck or a shared/published Jupyter notebook.
Collect: Unlike for Monitoring, the data for this use case only needs to be collected once and potentially updated a few times during the course of analysis. It may also use continually updated data sources created from Monitoring use cases. But in this case sticking to a single snapshot will often be necessary for consistency. Regardless, the complexity here is in identifying data sources of either type, determining what information they contain, and getting them into a location where the Exploration tools can access them.
Curate: Again, the complexity here comes from dealing with new data sources in a new context, and often for the first time. The user needs to asses both the form and content of the data, and its “quality” in terms of the particular analysis that they want to do. As noted in the last post, this exploration may be a pre-development step in a Monitoring or Prediction use case, which would also involve this source of complexity. A number of tools have been developed specifically for assessing data quality, though users can also use more generic analysis tools and libraries.
Transform: In this step, the user transforms the data from its raw form to a form that is better suited for statistics. As with the other steps, this is a one-off process so the complexity comes from determining how to do it, rather than making it a repeatable process. If the Collect and Curate steps were done well, then in theory this should be pretty straightforward. The many of the tools that work for Monitoring use cases can also be used in Exploration.
Model: For the Exploration use case, the Model stage is typically not a proper Machine Learning model, but rather a collection of statistical analyses/summaries. Because there’s a person involved, the analysis can go much deeper than it typically would for the Monitoring use case, delving into individual features, clusters and outliers. Many of the UI-based tools for the Transform stage will provide some level of this functionality, but code-based options will give you much more flexibility. For large-scale data, you may need distributed options like Spark or Dask.
Serve: Depending on how you’re planning to share the exploratory analysis, this stage may not require special tools/frameworks. For example, if the final product is a slide deck, there are plenty of good options for sharing them. If you want to share an analysis notebook, particularly with interactive graphs, things get a bit trickier. At the time I’m writing this, there are a few different options but no canonical solution.
Prediction
The Prediction use case involves training and deploying machine learning models, then querying them.
Collect & Curate: If you’re just training the model once, then walking away, we’ll consider that within the Exploration use case. Most of the complexity for this use case comes from updating the model based on new snapshots of the data. The Collect and Curate stages are similar to the Monitoring use case, in that the goal is to make them consistent and repeatable. However, the data quality metrics required to avoid model drift may be very different from the metrics for the Monitoring use case.
Transform: As with the Monitoring use case, the goal here is to define a standard set of transformations that are consistently applied each time the training data is updated. The transformations are often framed in terms of defining features – the standardized dimensions that feed into the predictive model. Many models, particularly neural networks, are able to learn additional transformations during the model stage, allowing the explicit transformation logic in the Transform stage to be simpler than in the Monitoring use case. So the Transform stage for Modeling will often include minimal explicit business logic. Sometimes even the feature definition transformations are learned, further blurring the lines between the Transform and the Model stages. For our purposes these steps fit better with the Model stage.
Model: The trained models in the Prediction use case are typically much more statistically complex than in the Monitoring use case. This stage turns each new snapshot of data into an updated trained model, so in addition to tracking drift of the raw data in the Curate stage, the user needs to monitor and identify drift in the model itself. The details vary widely based on the nature of the model, and while tools for this are becoming available, there is no canonical tools or approach.
Serve: The final trained model is often deployed as a service with an API and possibly an associated UI. There are a number of tools with different mixes of UI and code that make this relatively easy. You can also use more general app deployment frameworks like Docker. However, the complexity compared to a standard application or the Monitoring use case, is again managing drift to ensure that you didn’t miss any issues during the Model stage. In particular it’s often necessary to track the version of the model that made each prediction to look for unexpected statistical trends. You can write custom code for this, or many of the model-deployment frameworks provide some level of this. This is a rapidly developing area and at the time I’m writing this there isn’t a canonical solution.
Conclusion
Exploring the details of each of these use cases should help you start thinking about what kinds of tools you’ll need for the types of processes and workflows your organization will need to support down the road. Every situation is different and you can never predict everything that you’ll need. But by understanding the general shapes of these workflows, you can lay a solid foundation for supporting whatever comes your way.

3 thoughts on “Common Stages of Data Workflows”